| example | ||
| lib | ||
| screenshots | ||
| test | ||
| .gitignore | ||
| CHANGELOG.md | ||
| flutter_circular_chart.iml | ||
| LICENSE | ||
| pubspec.yaml | ||
| README.md | ||
Flutter Circular Chart
A library for creating animated circular chart widgets with Flutter, inspired by Zero to One with Flutter.
Overview
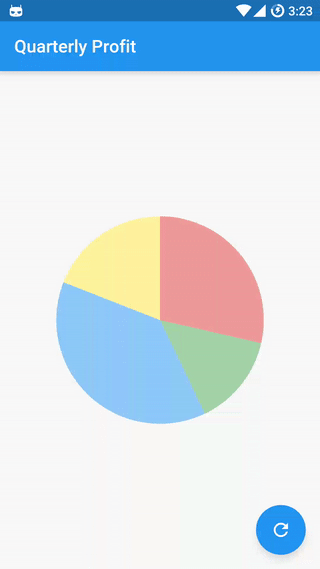
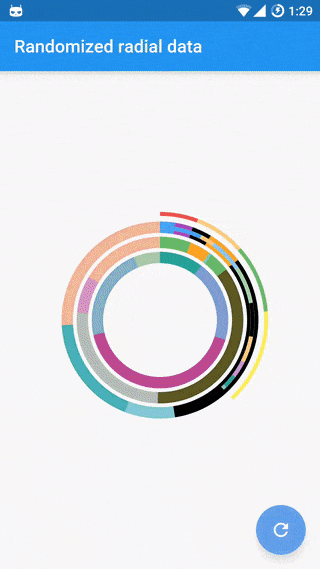
Create easily animated pie charts and radial charts by providing them with data objects they can plot into charts and animate between.
Check the examples folder for the source code for the above screenshots.
Contents:
Installation
Note: This is a WIP early implementation, use at your own risk. You can install it by including this git repository in your package dependencies:
  dependencies:
      flutter_circular_chart:
        git:
          url: git://github.com/xqwzts/flutter_circular_chart.git
Getting Started
Import the package:
import 'package:flutter_circular_chart/flutter_circular_chart.dart';
Create a GlobalKey to be able to access the chart and update its data:
final GlobalKey<AnimatedCircularChartState> _chartKey = new GlobalKey<AnimatedCircularChartState>();
Create chart data entry objects:
List<CircularStackEntry> data = <CircularStackEntry>[
  new CircularStackEntry(
    <CircularSegmentEntry>[
      new CircularSegmentEntry(500.0, Colors.red[200], rankKey: 'Q1'),
      new CircularSegmentEntry(1000.0, Colors.green[200], rankKey: 'Q2'),
      new CircularSegmentEntry(2000.0, Colors.blue[200], rankKey: 'Q3'),
      new CircularSegmentEntry(1000.0, Colors.yellow[200], rankKey: 'Q4'),
    ],
    rankKey: 'Quarterly Profits',
  ),
];
Create an AnimatedCircularChart, passing it the _chartKey and initial data:
@override
Widget build(BuildContext context) {
  return new AnimatedCircularChart(
    key: _chartKey,
    size: const Size(300.0, 300.0),
    initialChartData: data,
    chartType: CircularChartType.Pie,
  );
}
Call updateData to animate the chart:
void _cycleSamples() {
  List<CircularStackEntry> nextData = <CircularStackEntry>[
    new CircularStackEntry(
      <CircularSegmentEntry>[
        new CircularSegmentEntry(1500.0, Colors.red[200], rankKey: 'Q1'),
        new CircularSegmentEntry(750.0, Colors.green[200], rankKey: 'Q2'),
        new CircularSegmentEntry(2000.0, Colors.blue[200], rankKey: 'Q3'),
        new CircularSegmentEntry(1000.0, Colors.yellow[200], rankKey: 'Q4'),
      ],
      rankKey: 'Quarterly Profits',
    ),
  ];
  setState(() {
    _chartKey.currentState.updateData(nextData);
  });
}
Details
Chart data entries:
Charts expect a list of CircularStackEntry objects containing the data they need to be drawn.
Each CircularStackEntry corresponds to a complete circle in the chart. For radial charts that is one of the rings, for pie charts it is the whole pie.
Radial charts with multiple CircularStackEntrys will display them as concentric circles.
Each CircularStackEntry is composed of multiple CircularSegmentEntrys containing the value of a data point. In radial charts a segment corresponds to an arc segment of the current ring, for pie charts it is an individual slice.